The GSS User Interface for specialists
It describes the User Interface for specialists supporting end-users of the application at hand.
The User Interface for specialists lets them investigate the components of a Session History easily. The Session History consists of the following components:
Incident summary, as supplied by the end-user
Errors as data - we want both an overview of the errors in a session, and per error a stack of active identifiers such as defined parameters and procedures.
Profiler data - we want both an overview of the time taken per procedure, and an overview of the statements in the procedure selected.
Log files - those are not captured by tables, just by text editors.
Case file, containing the contents of the sets, parameters, and variables at the moment the incident was reported by the end-user.
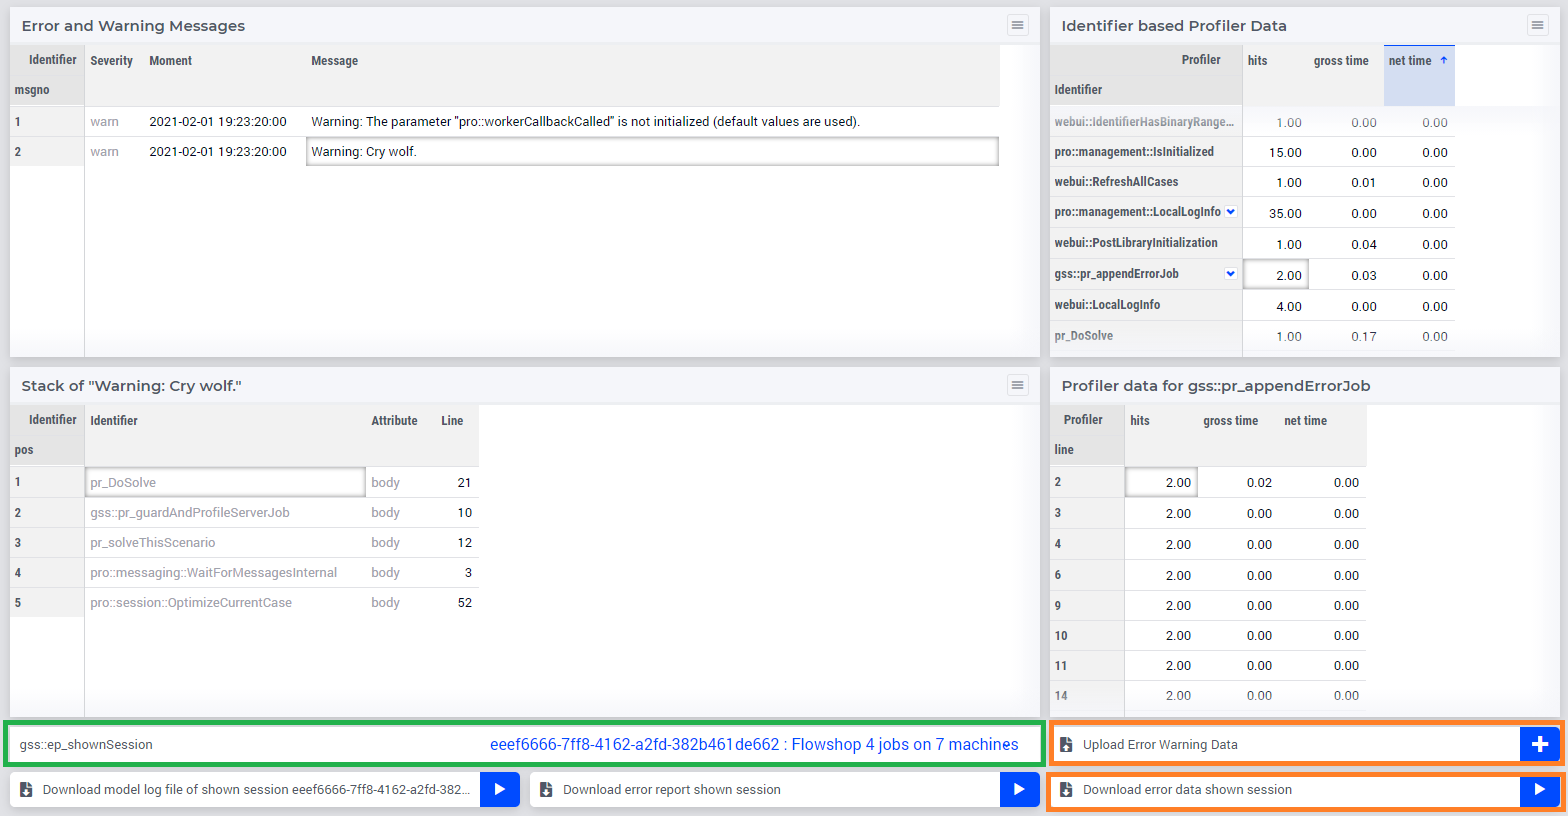
The user interface is shown in the GSS Session History Management below:
Remarks:
The
GSS Session History Managementopens by clicking the GSS status bar.The upper table on the left shows the error messages, with severity and creation moment.
The lower table on the left shows, for the selected error message, the stack of procedures that was active at the moment of creation.
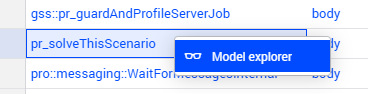
When right-clicking on an entry in that table, with AIMMS Developer, you can open the attribute window of the indicated procedure.
The upper table on the right shows the profiler data per identifier.
The lower table on the right shows the profiler data per line for the selected identifier.
The selection drop-down in the green rectangle is used to select the session shown. The collection of sessions to choose from consists of:
The data session
The server sessions running
The uploaded sessions
In the orange rectangles in the lower right, there is an upload and a download button for error data.
The download button is intended to be used by the end-user that wants to share an error report with the data and model specialists in her team.
The upload button is intended to be used by a data or model specialist that wants to investigate the errors reported by the end-user.
In the blue rectangles, in the left lower, download buttons for logging and state data.