Sessions
The Sessions page in the AIMMS Cloud Portal gives you a centralized overview of all application sessions that have run in your environment. The new Sessions page replaces the previous three-tab view (WebUI, Solver, Task) with a unified session list, bringing all session types i.e. WebUI, solve, external, verify sessions together in one place with significantly more data, filtering capabilities, and new analysis tools.
Note
If you need to access sessions from before this update, click Show legacy sessions in the top-right corner of the page.
Task sessions are currently available on the dedicated Tasks page. Support for Tasks will be added to the Sessions page in a future update.
How Concurrent Users are Counted
Client license sessions on the AIMMS Cloud Platform are counted per user per device combination, not per session. This means that a single user running multiple apps simultaneously from the same device occupies only one client license session — not one per app.
For example, if a user opens App A and App B at the same time on their laptop, that counts as one concurrent user. A second user opening any app on their own device counts as a second concurrent user.
Key Features
The new Sessions page introduces:
Unified session list — All sessions are now displayed in a single table, including External and Verify sessions together with WebUI and Solver sessions.
More data at a glance — New columns including session kind, environment, app version, and detailed timing metrics.
GbHour consumption — See resource usage per session directly in the table.
Session Stats — A dedicated tab with aggregated insights into session usage and performance across your applications.
Session Events — A new context menu option to view a chronological timeline of events for any session.
Improved filtering — A flexible filter bar to narrow down sessions across any column.
Page Overview
The Sessions page is divided into two tabs:
Data — The main session table with all session records and management actions.
Stats — Aggregated statistics and performance insights across your applications.
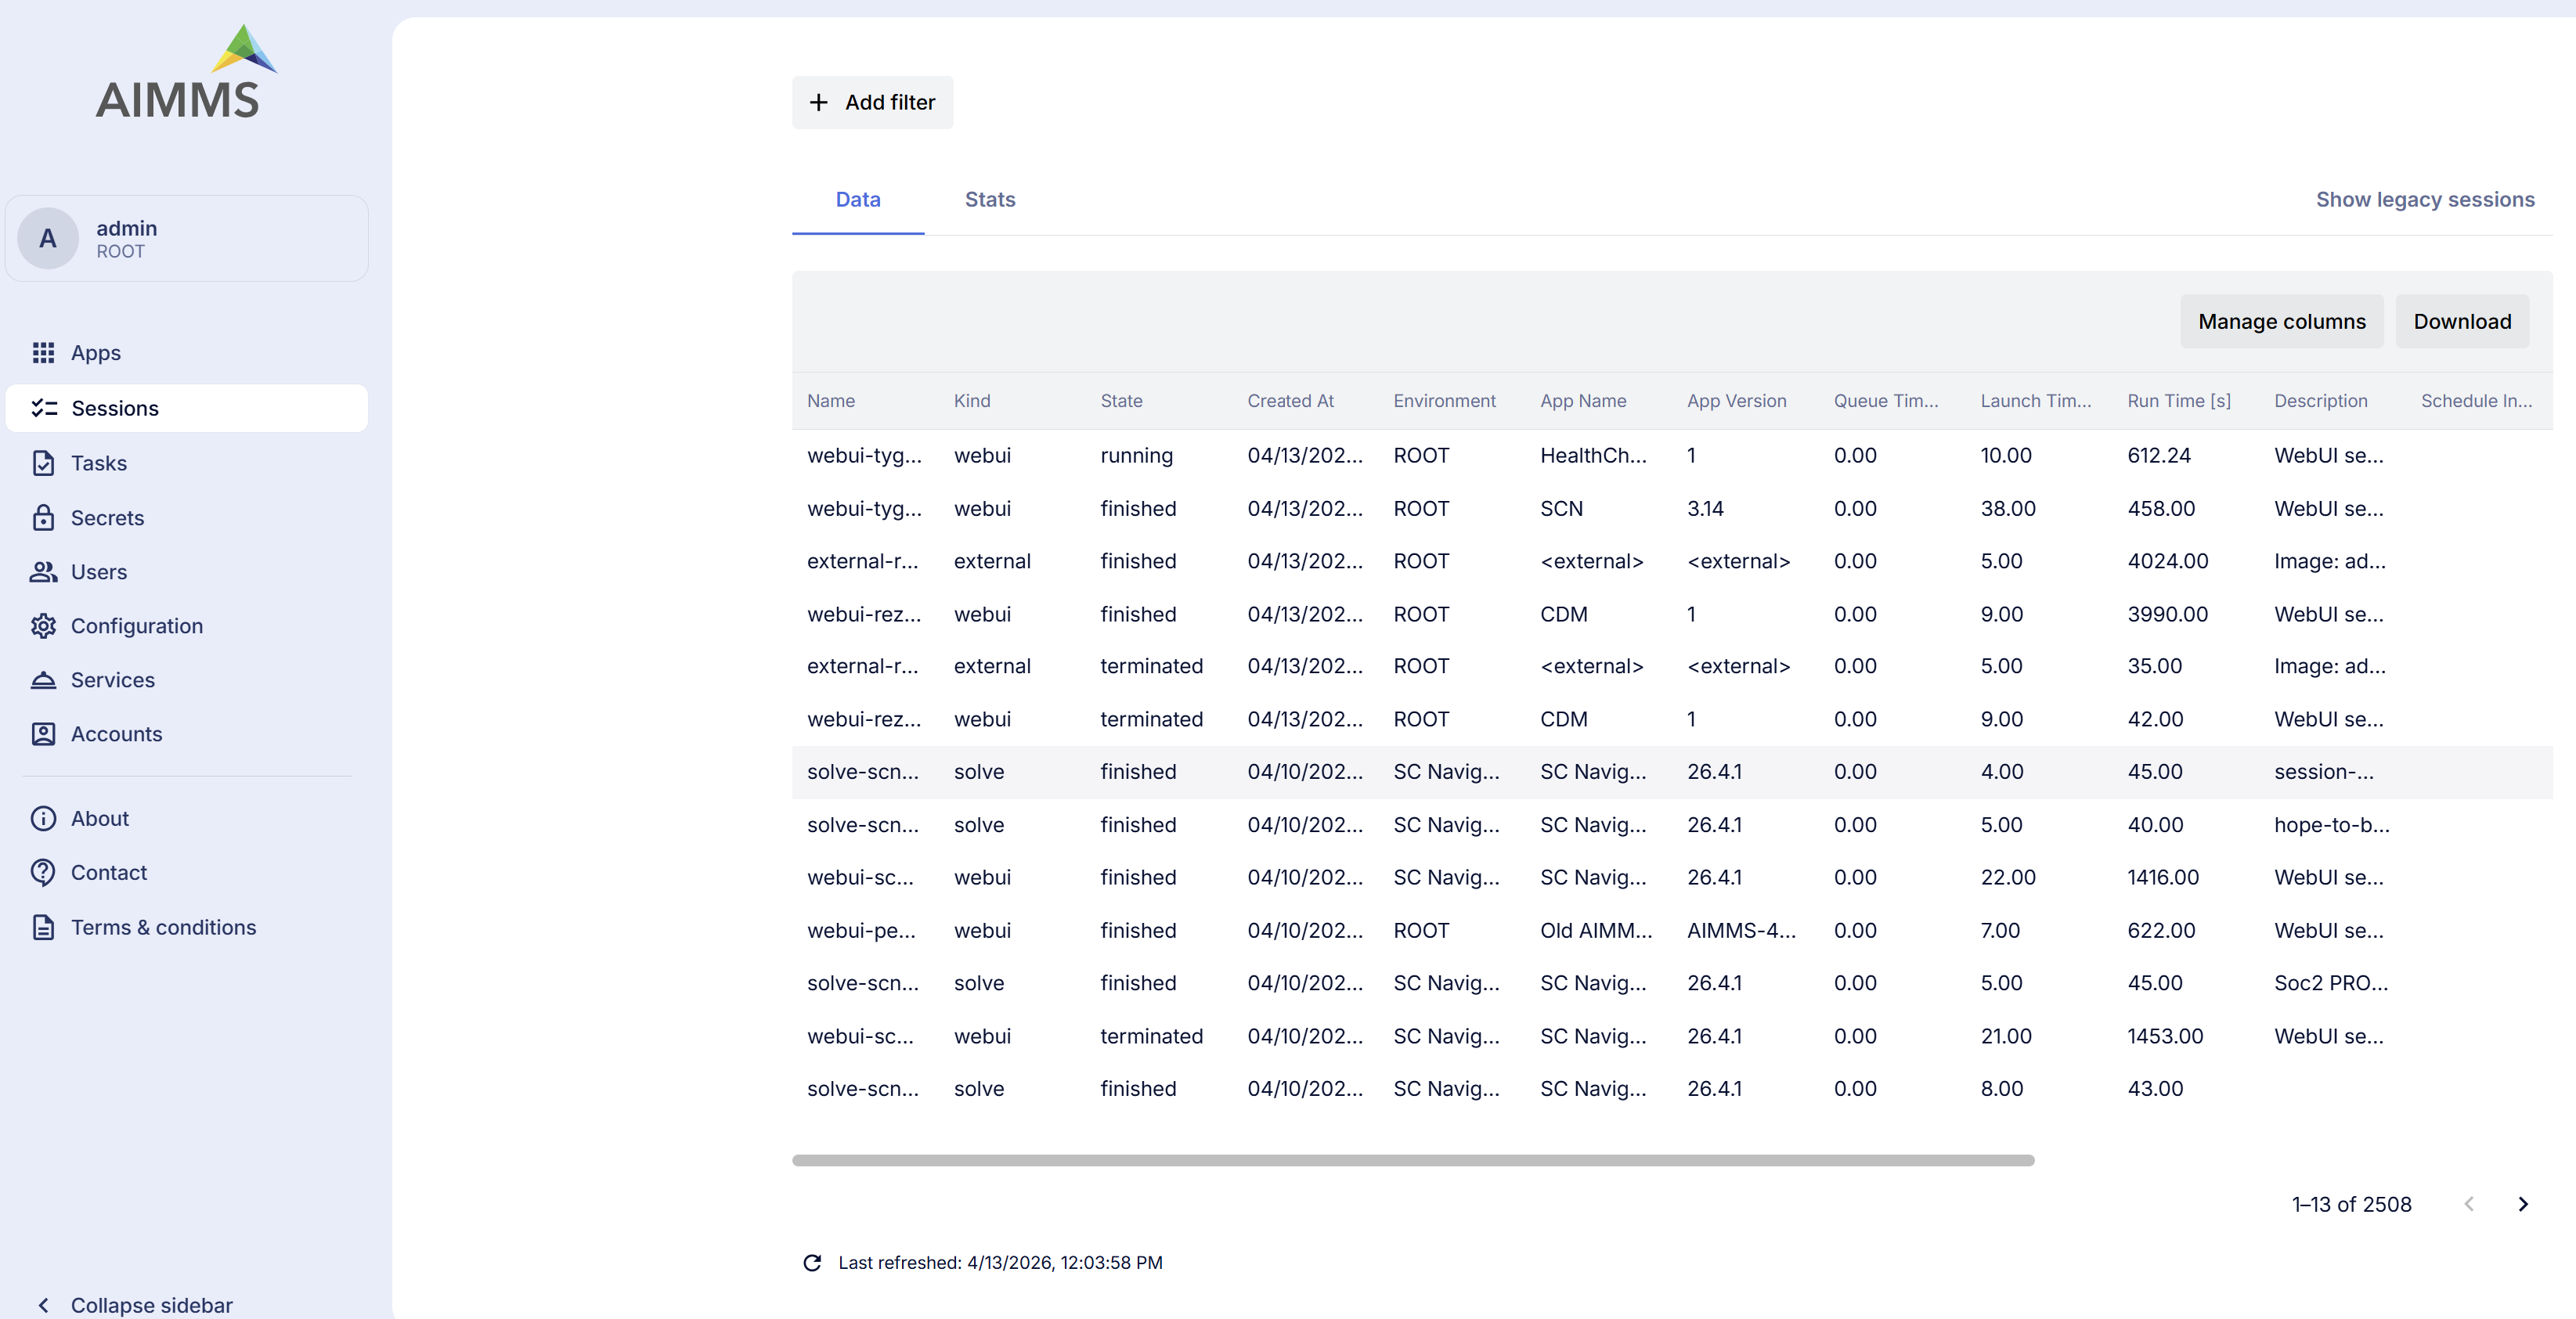
The Data Tab
Session Table
The Data tab displays all sessions — regardless of type — in a single unified table. Each row includes details such as the session name, kind, state, creation time, account, environment, user, app name and version, timing metrics (queue, launch, and run time), and GbHour consumption. Administrators see all sessions across all users. Regular users see only their own sessions.
The table displays sessions in pages. The number of rows shown per page is automatically adjusted based on your screen resolution.
External Sessions
External sessions are now visible in the Sessions page as part of the unified session list. All users can view external sessions, however only the session owner or an administrator can terminate them.
Resource Utilization
The Sessions page provides several columns to help you understand the resource consumption of each session.
GbHour Consumption
The GbHour column is available in both the Data and Stats tabs, allowing you to monitor resource consumption per session and across aggregated views — without needing to navigate to a separate report.
Peak Resource Columns
The following columns provide a more granular view of resource usage during a session and can be toggled via Manage Columns:
Peak Memory [Mi] — The highest amount of memory used at any point during the session.
Peak CPU [m] — The highest amount of CPU used at any point during the session.
Peak Memory Utilization [%] — Peak memory usage as a percentage of the session’s memory limit.
Peak CPU Utilization [%] — Peak CPU usage as a percentage of the session’s CPU limit.
The Stats tab provides corresponding statistical aggregates for each of the above peak columns: avg, min, max, p50 and p95 variants are available and can be toggled via Manage Stats.
Filtering and Sorting Sessions
Click + Add filter at the top of the page to filter the session list. You can apply multiple filters simultaneously across different columns (e.g., filter by state, user, account, or date range). To remove all active filters, use the Clear all option in the filter bar.
Each column in both the Data and Stats tabs can be sorted by clicking the column header. Note that applied filters are preserved when switching between the Data and Stats tabs, but sorting is reset when switching tabs.
Customizing the Table
Click Manage columns in the top-right toolbar to show or hide specific columns, tailoring the table to your needs. You can search for a column by name, toggle individual columns on or off, use Show/Hide All to quickly toggle all columns at once, or click Reset to restore the default column visibility.
Exporting Session Data
Click Download in the top-right toolbar to export the current session list for offline analysis or reporting.
Managing Individual Sessions
Context Menu Actions
Right-click a session row to open the context menu with the following options:
Session events — Opens a chronological timeline of all events that occurred during the session’s lifecycle, from queued to finished. Useful for understanding exactly what happened and when.
Session logs — Opens the full output log generated during the session. You can also download the log from this view for offline analysis or sharing with support.
Delete — Permanently removes the session record. Only available for sessions that are no longer active.
Terminate — Stops an active (running) session. Greyed out for sessions that have already finished or crashed.
Bulk Actions
To act on multiple sessions at once, select the rows you want and use the toolbar buttons(Terminate/Delete) that appear.
The Stats Tab
The Stats tab provides aggregated metrics on session usage and performance across your applications, including timing statistics such as min, max, and average queue and launch times. Use it to understand consumption patterns, identify performance trends, and get a high-level view of how sessions are being used across your environment.
To slice the data further, click + Add breakdown to group the results by one or more dimensions: Year, Month, Account, Environment, User, App Name, or App Version. This allows you to compare performance and consumption across different segments of your environment.
Similar to Manage columns on the Data tab, Manage stats lets you show or hide specific metric columns in the Stats table. You can also Download the aggregated data for offline analysis.
Legacy Sessions
To access sessions recorded before the new Sessions page was introduced, click Show legacy sessions in the top-right corner. This opens the previous session view with the WebUI and Solver tabs.