The AIMMS profiler
Meeting time requirements with solvers
Once your model is functionally complete, you may find that the overall computational time requirement set for the application is not met. If your application contains optimization, and most of the time is spent by the solver, finding a remedy for the observed long solution times may not be easy. In general, it involves finding a reformulation of the mathematical program which is more suitable to the selected solver. Finding such a reformulation may require a considerable amount of expertise in the area of optimization.
Meeting time requirements with data execution
It could also be, however, that optimization (if any) only consumes a small part of the total execution time. In that case, the time required for executing the application is caused by data manipulation statements. If total execution time is unacceptably high, it could be caused by inefficiently formulated statements. Such statements force AIMMS to fall back to dense instead of sparse execution. The AIMMS Sparse Execution Engine and Execution Efficiency Cookbook of the Language Reference discuss the principles of the sparse execution engine used by AIMMS, and describe several common pitfalls together with reformulations to remedy them.
The AIMMS profiler
AIMMS offers a profiler to help you resolve computational time related issues. The AIMMS profiler enables you to locate the most time-consuming evaluations of
procedures and functions,
individual statements within procedures and functions,
defined sets and parameters, and
constraints and defined variables during matrix generation.
Activating the profiler
You can activate the AIMMS profiler by selecting the Tools-Diagnostic Tools-Profiler menu, which will add a Profiler menu to the default system menu bar. If the debugger is still active at this time, it will be automatically deactivated, as both tools cannot be used simultaneously.
Gathering timing information
As soon as you have activated the profiler, AIMMS will start gathering timing information during every subsequent procedure run or definition evaluation, regardless whether these are initiated by pushing a button on an end-user page, by executing a procedure from within the Model Explorer, or even by means of a call to the AIMMS API from within an external DLL.
Viewing profiler results
After you have gathered timing information about your modeling application by executing the relevant parts of your application at least once, you can get an overview of the timing results through the Profiler-Results Overview menu. This will open the Profiler Results Overview dialog box illustrated in Fig. 43.
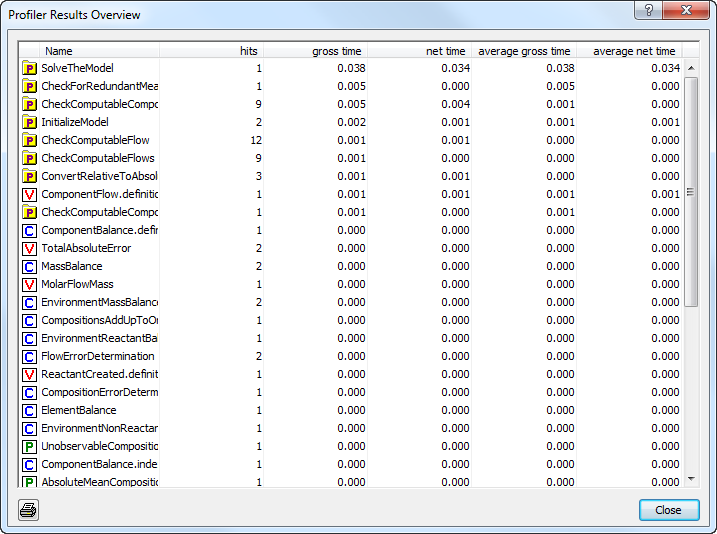
Fig. 43 The Profiler Results Overview dialog box
In it, you will find a list of all procedures that have been executed and identifier definitions that have been evaluated since the profiler was activated.
Detailed timing information
For each procedure, function, or defined identifier listed in the Profiler Results Overview dialog box, AIMMS will provide the following information:
the number of hits (i.e. the number of times a procedure has been executed or a definition has been evaluated),
the total gross time (explained below) spent during all hits,
the total net time (explained below) spent during all hits,
the average gross time spent during each separate hit, and
the average net time spent during each separate hit.
Gross versus net time
The term gross time refers to the total time spent in a procedure including the time spent in procedure calls or definition evaluations within the profiled procedure. The term net time refers to the total time spent excluding the time spent in procedure calls or definition evaluations within the profiled procedure.
Locating time-consuming procedures
With this timing information you can try to locate the procedures and identifier definitions which are most likely to benefit from a reformulation to improve efficiency. To help you locate these procedures and definitions, the list of procedures and definitions in the Profiler Results Overview dialog box can be sorted with respect to all its columns. The most likely criterion for this is to sort by decreasing net time or average net time, which will identify those procedures and identifier definitions which take up the most time by themselves, either in total or for each individual call. You can open the attribute form of any identifier in the Profiler Results Overview dialog box by simply double-clicking on the corresponding line.
Locating offending statements
When you have located a time-consuming procedure, you can can open its attribute form and try to locate the offending statement(s). Whenever the profiler has been activated, AIMMS will add additional profiling columns to the body of a procedure, as illustrated in Fig. 44.
Similarly, AIMMS will add these profiling columns to the definition attributes of defined identifiers.
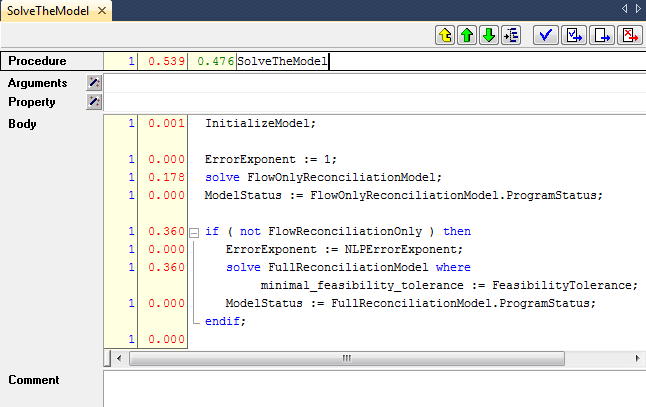
Fig. 44 Profiling information in an attribute form
Profiling column information
For each statement in the body of a procedure, AIMMS can display various types of profiling data in the profiling columns of an attribute form. As you can see next, this information is even more extensive than for procedures as a whole. The following information is available:
the number of hits (i.e. the number of times a particular statement has been executed),
the total gross time spent during all hits,
the total net time spent during all hits,
the average gross time spent during each separate hit, and
the average net time spent during each separate hit.
Gross versus net time for particular statements
In the context of a procedure body, the difference between gross and net time need not always refer only to the time spent in other procedures (as in the Profiler Results Overview dialog box). For selected statements both numbers may have a somewhat different, yet meaningful, interpretation. Some exceptions:
in flow control statements such as the
IF,WHILEandFORstatement (see also Flow Control Statements of the Language Reference), the net time refers to the time required to evaluate the statement itself (for instance, its condition) whereas the gross time refers to the time required to execute the entire statement,in the
SOLVEstatement (see also The SOLVE Statement of the Language Reference), the net time refers to the time spent in the solver, while the gross time refers to the time spent in the solver plus the time required to generate the model.in a procedure call itself the net time refers to the time spent in argument passing.
Profiler tooltips
In addition to observing the profiling times in the Profiler Results Overview and through the profiling columns in attribute windows, AIMMS also provides profiling tooltips in both the Model Explorer and in the attribute windows of procedures and defined identifiers, as long as the profiler is active. An example of a profiling tooltip is given in Fig. 45.
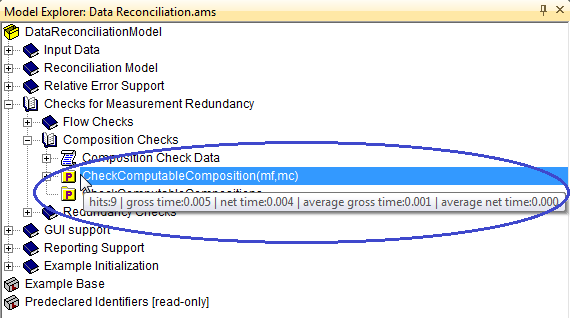
Fig. 45 Observing profiling information through a tooltip
Profiling tooltips can provide a convenient method to quickly observe the profiling information without requiring any further interaction with AIMMS. If you do not want AIMMS to display profiling tooltips while moving your mouse through either the Model Explorer or procedure bodies, you can disable them through the Profiler Setup dialog box described below, by unchecking the Show Profiler Values check mark (see also Fig. 46).
Profiler listing
If you are interested in a profiling overview comprising your entire modeling application, you can get this through the Profiler-Create Listing File menu. This will create a common source listing file of your model text extended with profiling information wherever this is available. Through the Profiler Setup dialog box described below you can determine which profiler information will be added to the profiler listing.
Setting up profiling columns
For every new project, AIMMS uses a set of default settings to determine which profiling information is displayed in the various available methods to display profiling information. You can modify these settings through the Profiler-Setup menu, which will open the Profiler Setup dialog box illustrated in Fig. 46.
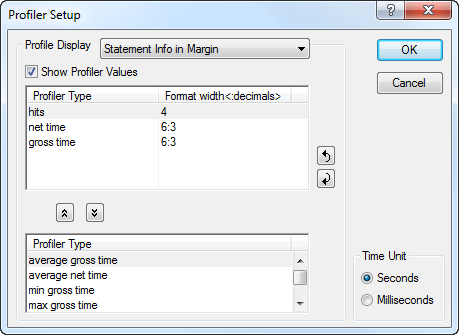
Fig. 46 The Profiler Setup dialog box
In this dialog box you can, on a project-wide basis, determine
which of the profiling display methods described are enabled (through the Show Profiler Values check mark), and
per such display method, which profiling information is to be displayed, their order, and their corresponding display format.
The settings selected in the Profiler Setup dialog box are saved along within the project file, and will be restored when you reopen the project in another AIMMS session.
Pausing and continuing the profiler
Through the Profiler-Pause menu, you can temporarily halt the gathering of profiling information by AIMMS, while the existing profiling information will be retained. You can use this menu, for example, when you only want to profile the core computational procedures of your modeling application and do not want the profiling information to be cluttered with profiling information that is the result of procedure calls and definition evaluations in the end-user interface. You can resume the gathering of profiling information through the Profiler- Continue menu.
Resetting the profiler
With the Profiler-Reset menu, you can completely reset all profiling counters to zero. You can use this menu, if the profiling information of your application has become cluttered. For instance, some procedures may have been executed multiple times and, thus, disturb the typical profiling times required by your entire application. After resetting the profiling counters, you can continue to gather new profiling information which will then be displayed in the various profiling displays.
Exiting the profiler
You can completely disable the AIMMS profiler through the Profiler-Exit Profiler menu. As a result, the gathering of profiling information will be completely discontinued, and all profiling counters will be reset to zero. Thus, when you restart the profiler, all profiling information of a previous session will be lost.