The AIMMS debugger
Tracking modeling errors
When your model contains logical errors or programming errors, finding the exact location of the offending identifier declarations and/or statements may not be easy. In general, incorrect results might be caused by:
incorrectly specified attributes for one or more identifiers declared in your model (most notably in the
IndexDomainandDefinitionattributes),logical oversights or programming errors in the formulation of one or more (assignment) statements in the procedures of your model,
logical oversights or programming errors in the declaration of the variables and constraints comprising a mathematical program, and
data errors in the parametric data used in the formulation of a mathematical program.
Errors in mathematical programs
If the error is in the formulation or input data of a mathematical program, the main route for tracking down such problems is the use of the Math Program Inspector discussed in The Math Program Inspector. Using the Math Program Inspector you can inspect the properties of custom selections of individual constraints and/or variables of a mathematical program.
The AIMMS debugger
To help you track down errors that are the result of misformulations in assignment statements or in the definitions of defined parameters in your model, AIMMS provides a source debugger. You can activate the AIMMS debugger through the Tools-Diagnostic Tools-Debugger menu. This will add a Debugger menu to the system menu bar, and, in addition, add the Debugger toolbar illustrated in Fig. 34 to the toolbar area.

Fig. 34 The Debugger toolbar
You can stop the AIMMS debugger through the Debugger-Exit Debugger menu.
Debugger functionality
Using the AIMMS debugger, you can
set conditional and unconditional breakpoints on a statement within the body of any procedure or function of your model, as well as on the evaluation of set and parameter definitions,
step through the execution of procedures, functions and definitions, and
observe the effect of single statements and definitions on the data within your model, either through tooltips within the observed definitions and procedure bodies, or through separate data pages (see also Viewing and modifying identifier data)
Setting breakpoints in the body
Within the AIMMS debugger you can set breakpoints on any statement in a
procedure or function body (or on the definition of a defined set,
parameter or variable) by selecting the corresponding source line in the
body of the procedure or function, and choosing the
Debugger-Breakpoints-Insert/Remove menu (or the Insert/Remove
Breakpoint button  on the Debugger toolbar). After you
have set a breakpoint, this is made visible by means of red dot in the
left margin of selected source line, as illustrated in
Fig. 35.
on the Debugger toolbar). After you
have set a breakpoint, this is made visible by means of red dot in the
left margin of selected source line, as illustrated in
Fig. 35.
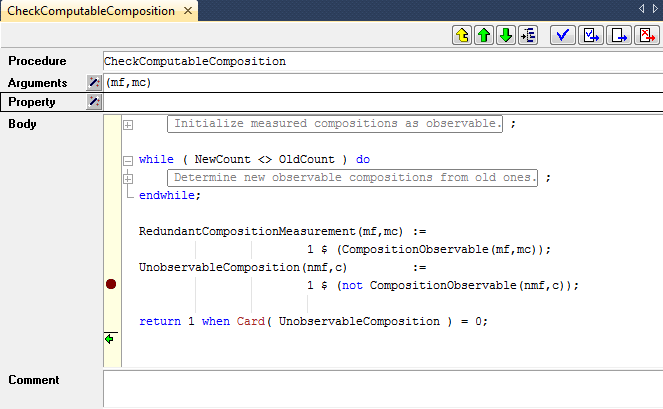
Fig. 35 Setting a breakpoint in a procedure body
Setting breakpoints in the model tree
Alternatively, you can set a breakpoint on a procedure, function or on a defined set, parameter or variable by selecting the corresponding node in the Model Explorer, and choosing the Debugger-Breakpoints-Insert/Remove menu. As a result, AIMMS will add a breakpoint to the first statement contained in the body of the selected procedure or function. The name of a node of any procedure, function or defined set, parameter or variable with a breakpoint is displayed in red in the model tree, as illustrated in Fig. 36.
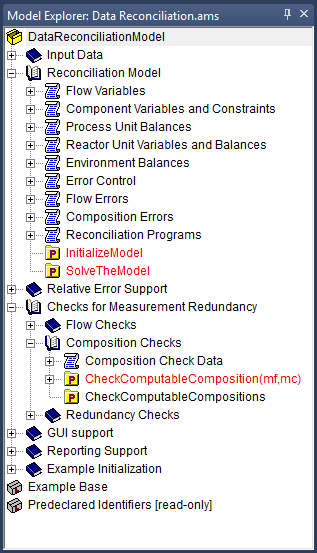
Fig. 36 Viewing procedures with breakpoints in the Model Explorer
Entering the debugger
Once you have set a breakpoint in your model, AIMMS will automatically stop at this breakpoint whenever a line of execution arrives at the corresponding statement. This can be the result of
explicitly running a procedure within the Model Explorer,
pushing a button on an end-user page which results in the execution of one or more procedures, or
opening an end-user (or data) page, which requires the evaluation of a defined set or parameter.
Whenever the execution stops at a breakpoint, AIMMS will open the
corresponding procedure body (or the declaration form of the defined
set, parameter or variable), and show the current line of execution
through the breakpoint pointer  , as illustrated in
Fig. 37.
, as illustrated in
Fig. 37.
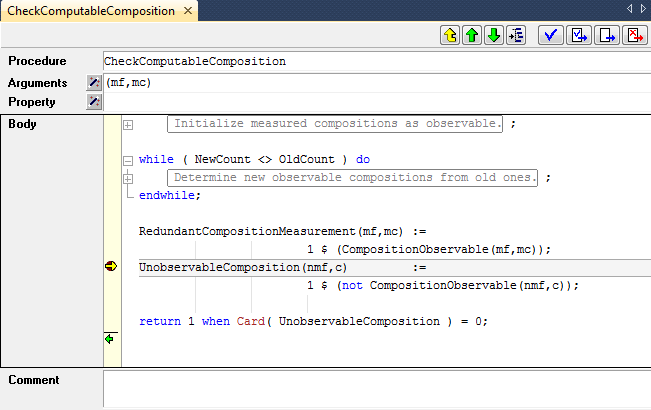
Fig. 37 Arriving at a breakpoint
Interrupting execution
Even when you have not set breakpoints, you can still enter the debugger by explicitly interrupting the current line of execution through the Run-Stop menu (or through the Ctrl-Shift-S shortcut key). It will pop up the Stop Run dialog box illustrated in Fig. 38
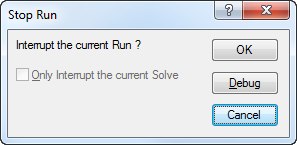
Fig. 38 The Stop Run dialog box
When you have activated the AIMMS debugger prior to execution, the Debug button on it will be enabled, and AIMMS will enter the debugger when you push it. By pushing the OK or Cancel button, AIMMS will completely stop or just continue executing, respectively.
Interrupting slow statements
The above method of interrupting AIMMS will not work when AIMMS is
executing a statement or definition that takes a very long time. In that
case you can interrupt AIMMS via the AimmsInterrupt tool. This tool
is available from the Windows start All Programs menu. Upon startup, it
will place itself in the system tray. By right-clicking the AIMMS system
tray icon, you’ll obtain a menu of running AIMMS instances that can be
interrupted. In developer mode, the interrupted AIMMS will also popup a
debugger showing where it has been interrupted. With that debugger, you
can’t continue execution, however; as the consistency of the values of
the identifier(s) being computed during the interrupt can’t be
guaranteed. On the other hand, you can start new procedures. In end-user
mode, the interrupted AIMMS will just issue an error message, indicating
the interrupted statement, definition or constraint.
Stepping through statements
Once AIMMS has interrupted a line of execution and entered the debugger, you can step through individual statements by using the various step buttons on the Debugger toolbar and follow the further flow of execution, or observe the effect on the data of your model. AIMMS offers several methods to step through your code:
the Step Over
 method runs a single statement, and,
when this statement is a procedure call, executes this in its
entirety,
method runs a single statement, and,
when this statement is a procedure call, executes this in its
entirety,the Step Into
 method runs a single statement, but,
when this statement is a procedure call, sets the breakpoint pointer
to the first statement in this procedure,
method runs a single statement, but,
when this statement is a procedure call, sets the breakpoint pointer
to the first statement in this procedure,the Step Out
 method runs to the end of the current
procedure and sets the breakpoint pointer to the statement directly
following the procedure call in the calling context, and
method runs to the end of the current
procedure and sets the breakpoint pointer to the statement directly
following the procedure call in the calling context, andthe Run To Cursor
 method runs in a single step from
the current position of the breakpoint pointer to the current
location of the cursor, which should be within the current
procedure.
method runs in a single step from
the current position of the breakpoint pointer to the current
location of the cursor, which should be within the current
procedure.
In addition, AIMMS offers some methods to continue or halt the execution:
the Continue Execution
 method continues execution,
but will stop at any breakpoint it will encounter during this
execution,
method continues execution,
but will stop at any breakpoint it will encounter during this
execution,the Finish Execution
 method finishes the current line
of execution, ignoring any breakpoints encountered,
method finishes the current line
of execution, ignoring any breakpoints encountered,the Halt
 method immediately halts the current line of
execution.
method immediately halts the current line of
execution.
Examining identifier data
Whenever you are in the debugger, AIMMS allows you to interactively examine the data associated with the identifiers in your model, and observe the effect of statements in your source code. The most straightforward method is by simply moving the mouse pointer over a reference to an identifier (or identifier slice) within the source code of your model. As a result, AIMMS will provide an overview of the data contained in that identifier (slice) in the form of a tooltip, as illustrated in Fig. 39.
The tooltip will provide global information about the identifier slice at hand, such as
its name and indices,
the number of elements or non-default data values (in brackets), and
the first few elements or non-default data value in the form of a list consisting of tuples and their corresponding values.
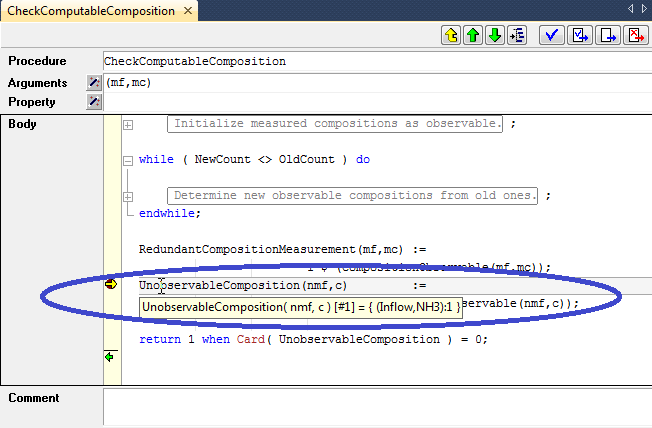
Fig. 39 Observing the current data of an identifier through a tooltip
Detailed identifier data
If you need to examine the effect of a statement on the data of a particular identifier in more detail, you can simply open a Data Page, as described in Viewing and modifying identifier data, or observe the effect on ordinary end-user pages. Within a debugger session, AIMMS supports data pages for both global and local identifiers, thereby allowing you to examine the contents of local identifiers as well. After each step in the debugger AIMMS will automatically update the data on any open end-user or data page.
Breakpoint on data change
If you are not sure which statement in your model is responsible for changing the data of a (non-defined) set or parameter, you can set a breakpoint on such a set or parameter. Whenever a statement in your model changes the set or parameter data at hand, AIMMS will break on that statement. Notice, however, that breakpoint on data change will not pick up data changes that are due to set or parameter data becoming inactive because of changes to sets or parameters included in the domain or domain condition.
Viewing the call stack
Whenever you are in the debugger, the Call Stack button  on the Debugger toolbar will display the Call Stack dialog box
illustrated in Fig. 40.
on the Debugger toolbar will display the Call Stack dialog box
illustrated in Fig. 40.
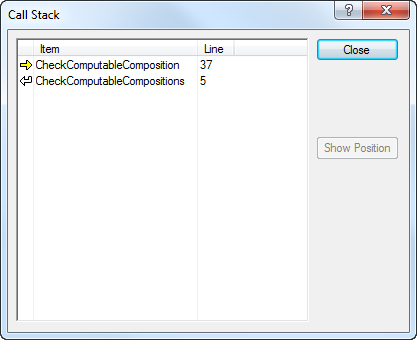
Fig. 40 The Call Stack dialog box
With it you get a detailed overview of the stack of procedure calls associated with the current line of execution. It enables you to observe the flow of execution at the level of procedures associated with the current position of the breakpoint pointer. After selecting a procedure or definition in the Call Stack dialog box, the Show Position button will open its attribute window at the indicated line.
Viewing and modifying breakpoints
After you have inserted a number of breakpoints into your model, you can
get an overview of all breakpoints through the Show All Breakpoints
button  . This button will invoke the List of Breakpoints
dialog box illustrated in Fig. 41.
. This button will invoke the List of Breakpoints
dialog box illustrated in Fig. 41.
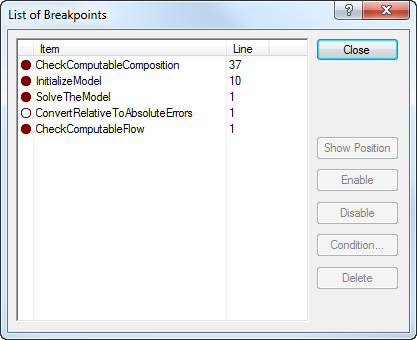
Fig. 41 The List of Breakpoints dialog box
For each breakpoint, AIMMS will indicate whether it is enabled or disabled (i.e. to be ignored by the AIMMS debugger). Through the buttons on the right hand side of the dialog box you can
disable breakpoints,
enable previously disabled breakpoints,
delete breakpoints, and
create new breakpoints.
Alternatively, you can disable or remove all breakpoints simultaneously
using the Disable All Breakpoints button  and the
Remove All Breakpoints button
and the
Remove All Breakpoints button  .
.
Conditional breakpoints
In addition, by pushing the Condition button on the List of Breakpoints dialog box, you can add a condition to an existing breakpoint. It will open the Breakpoint Condition dialog box illustrated in Fig. 42.
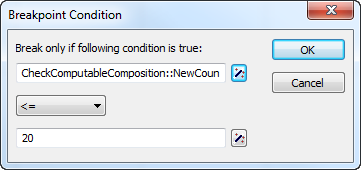
Fig. 42 The Breakpoint Condition dialog box
The condition must consist of a simple numerical, element or string comparison. This simple comparison can only involve scalar identifiers, identifier slices or constants. Free indices in an identifier slice are only allowed when they are fixed within the breakpoint context (e.g. through a for loop). AIMMS will only stop at a conditional breakpoint, when the condition that you have specified is met during a particular call. Conditional breakpoints are very convenient when, for instance, a procedure is called very frequently, but only appears to contain an error in one particular situation which can be detected through a simple comparison.